Using Vised
Overview
Teaching: 10 min
Exercises: 0 minQuestions
How do we set up, configure, and use the vised_marks plugin?
Objectives
To configure vised marks which will enable editing the marks in a scroll plot.
To learn how to add, remove, and edit marks in the scroll plot.
Load a Vised Configuration file
The Vised configuration editor allows users to customise the vised plot behaviour. The user interface produces a configuration file that can be loaded as the default for future projects.
-
In the main EEGLAB window, navigate to File->Vised Configuration.
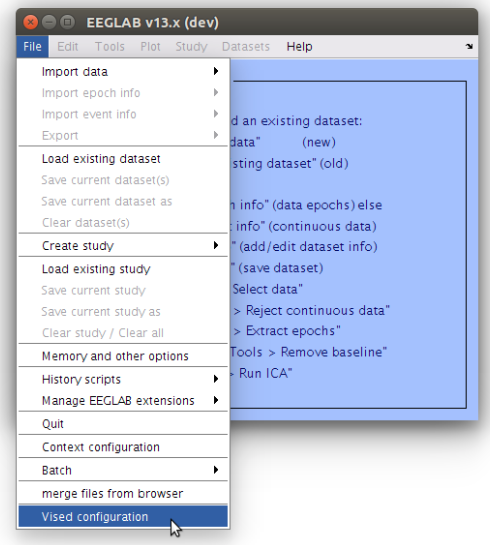
-
If you already have a configuration file you can load it by clicking
| Load vised config |and browsing to the file location. The default configuration file isderivatives/lossless/code/config/vised_config.cfg. You may also create your own configuration file by filling in some of the property fields and clicking| Save as |to save the file.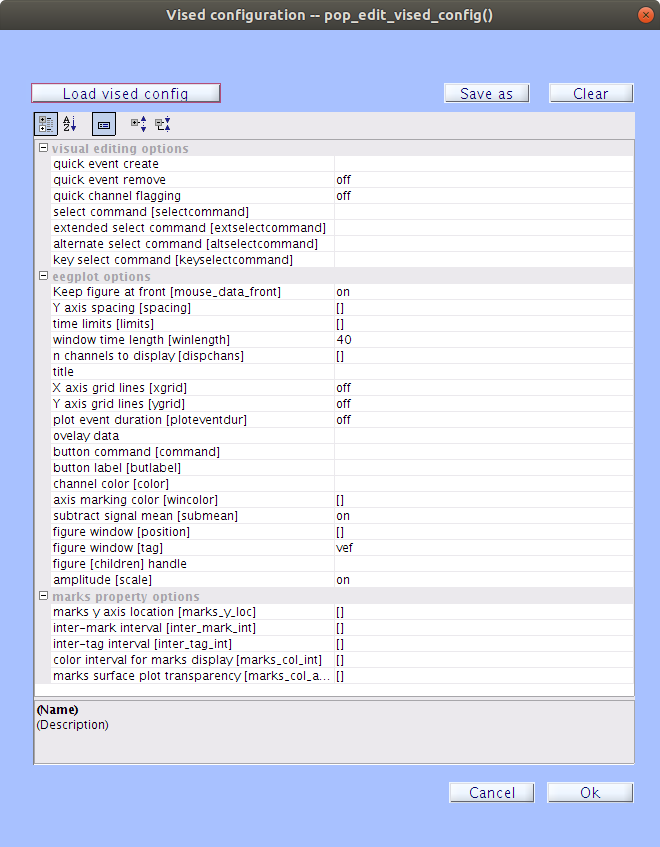
-
Click the
| ... |on Linux or Windows or the| ↕ |on Mac at the very right side of thekey Select Commandfield. You will notice the following popup window: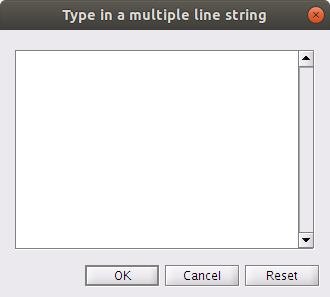
-
Here, you can add key presses to trigger adding or removing of a mark. Each key press appears on a new line. The format is: the desired key press, followed by a comma, then followed by a function call. For example, to add a manual mark called ‘custom_mark’, you would add the following line:
m,ve_edit('awm','custom_mark')To remove the ‘custom_mark’, you would add the following line:
M,ve_edit('rwm','custom_mark')Note
We used the ‘m’ and ‘M’ key presses as an example, but you can select any keys you want here. For more information about all the different options for key presses and functions that can be paired, see the episode about options.
-
Once you have created or loaded the vised configuration file, click
| Ok |to load the file into EEGLAB.
Note
Saving the vised configuration after personalising settings can save a lot of time!
Open the Vised EEG scroll plot
-
In the main EEGLAB window, load a data file by navigating to File->Load existing dataset and select a
*.setfile. -
Again, in the main EEGLAB window, navigate to Edit->Visually edit in scroll plot.
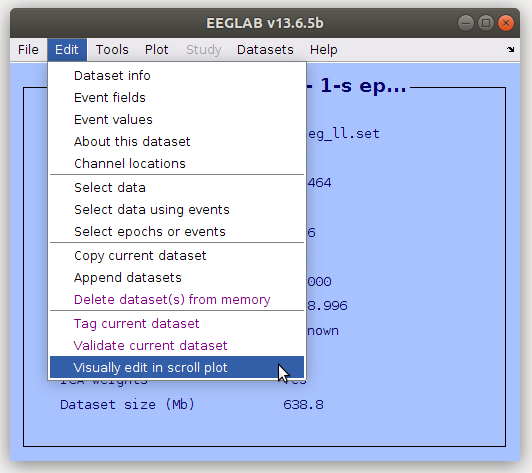
-
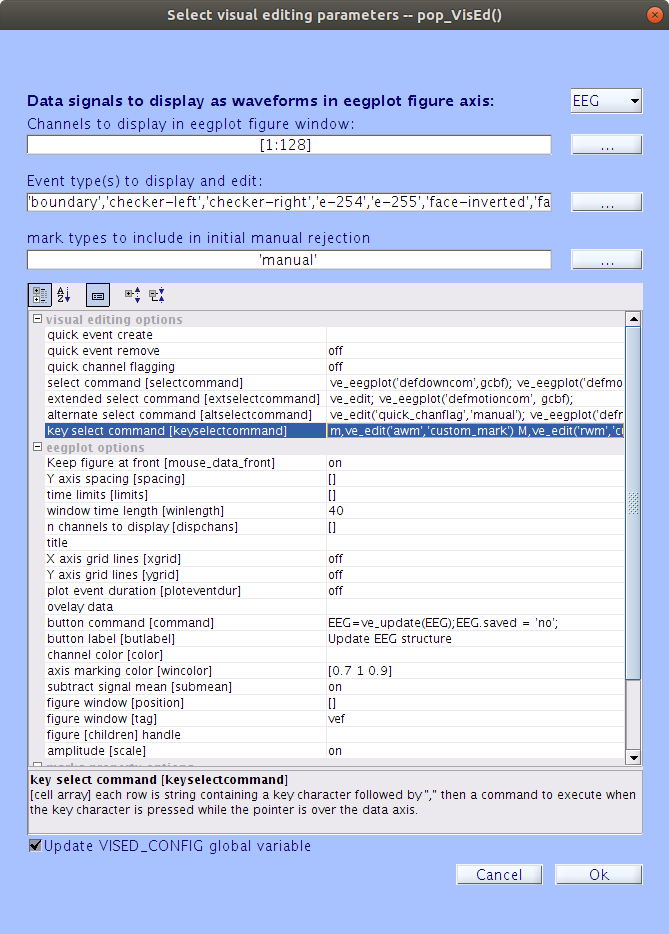
You will see a similar window appear as the one where you load the Vised configuration file, but with a few extra options at the top.
-
If there was an ICA performed on the file, you have the option of viewing the component scroll plot in addition to the EEG scroll plot, which displays each component as a waveform rather than each channel. This option can be selected using the drop-down menu in the top right of the window. Once you have selected the type of scroll plot, click
| Ok |to display the scroll plot.
Note
If you are a Mac user, you may need to set a value for the
Y axis spacingfield to avoid an error. Usually, a value between 50 and 100 is a reasonable scale for EEG and between 4 and 20 is reasonable for ICA.
Editing Marks Visually
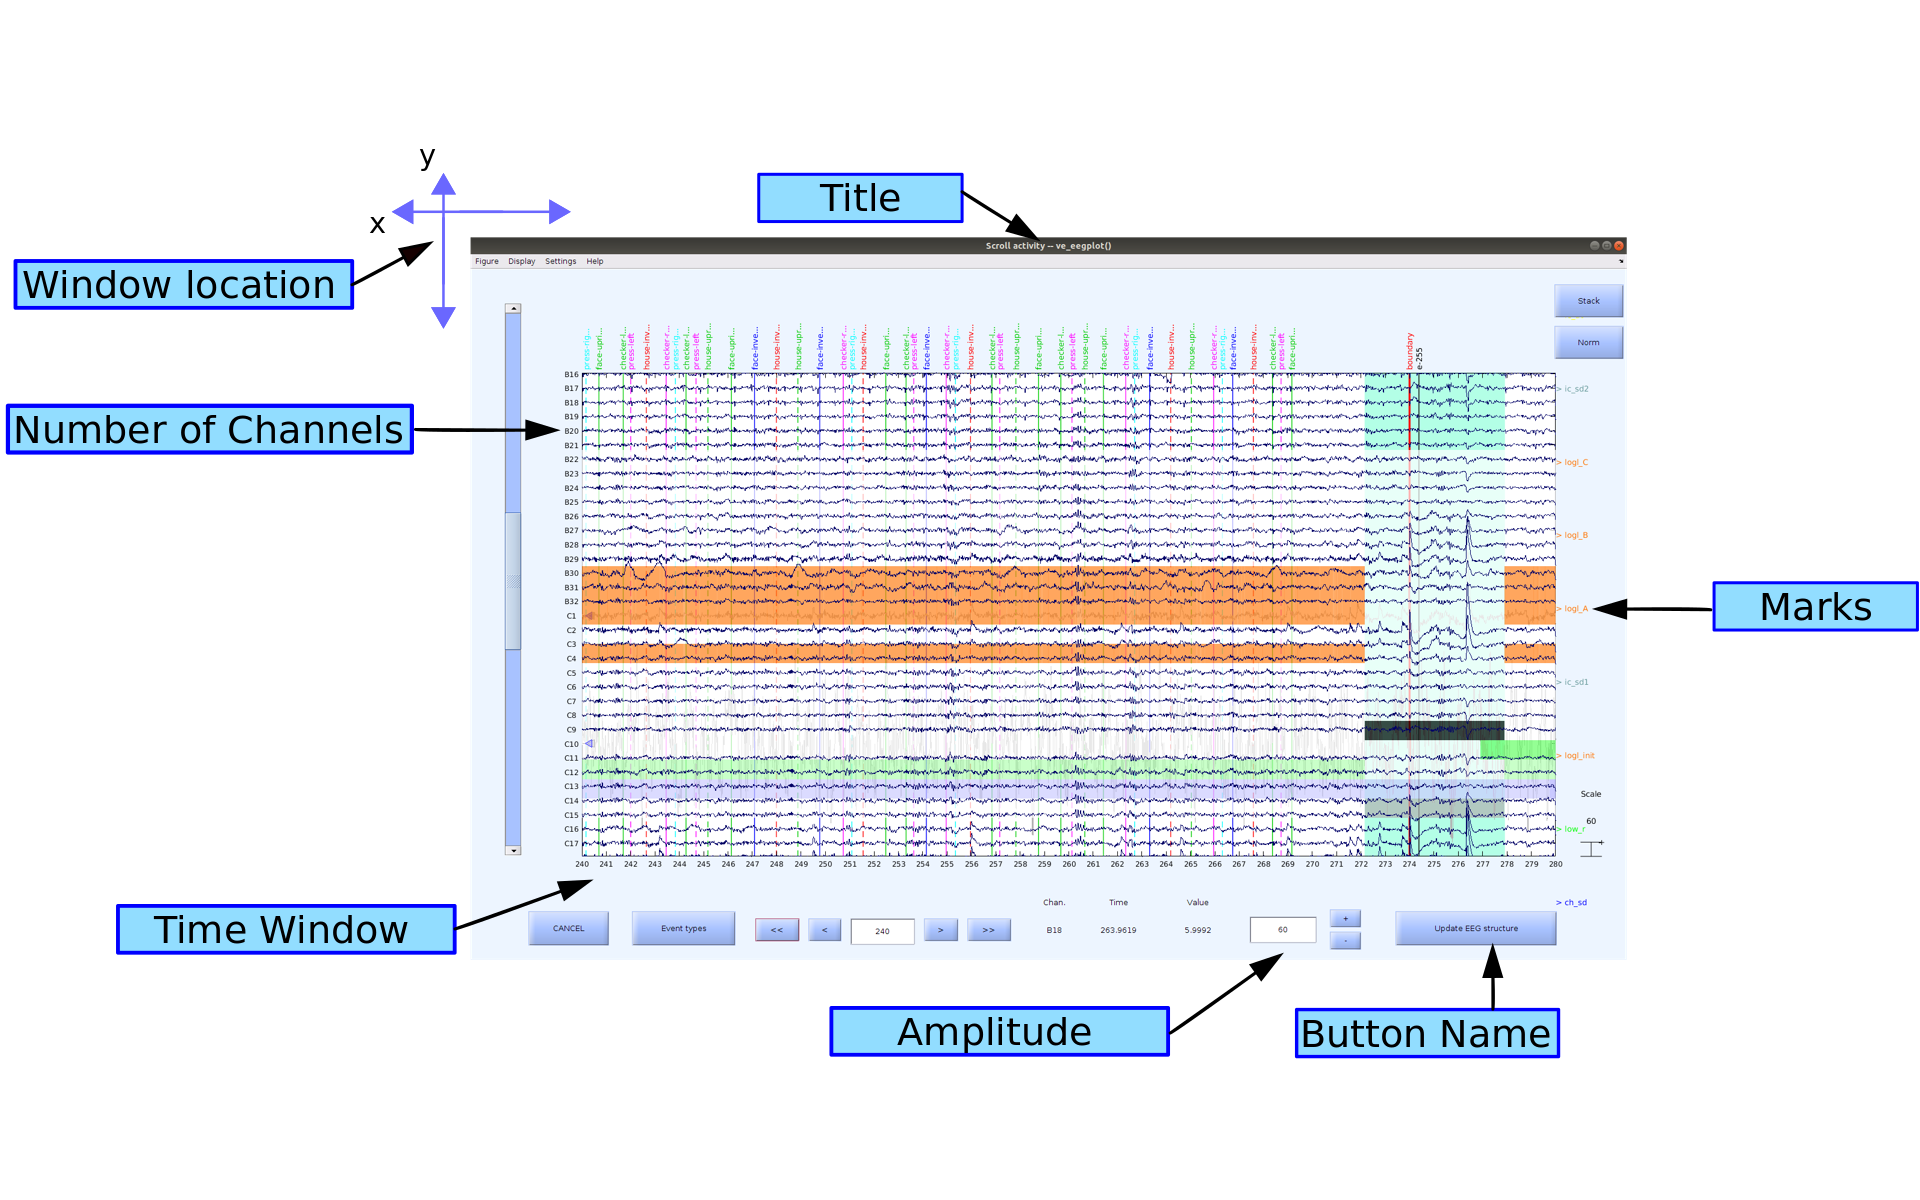
When you click the | Ok | button at the bottom of the interface, a scroll plot of your data that is set up the way you specified in the configuration should pop up:
Note
If you get an error in the matlab command window, make sure you have set your default renderer correctly:
> set(0,'DefaultFigureRenderer','OpenGL');
Marks can either be in the x-axis (time) or in the y-axis (channels/components) depending on what functions you are using.
- If you are selecting a channel ([right-click]), you will see the whole channel get selected. In the case of a removal, this will remove the whole channel from the data.
- If you are selecting using the winrej highlighting tool ([left-click -> drag -> release left-click] in MATLAB 2014b or later, OR [left-click -> release left-click -> drag -> left-click -> release left-click] in earlier versions) in the time axis, you will be selecting a particular time period but also all of the channels/components at once. In the case of doing a removal you will be deleting all of the channel data during that time frame. The missing time will then be indicated by a boundary event. You cannot remove a time section from only a single channel, as the time for all the channels need to match.
Note
The vertical location of the color indicator on the screen does not matter, as it is applied to all of the channels during the selected time frame. If you have two colors during the same time frame it means the data is flagged for both reasons. If you scroll up and down through the channels you will see that the color marks do not move while the channels scroll up and down unattached.
Adding a Mark
-
To start adding marks, use the winrej highlighting tool ([left-click]) and hover your mouse over the selected data.
-
Then, use one of the hotkeys you have assigned to mark the data with the desired mark. In the example below, a awm mark named ‘custom_mark’ was added by using the key select command string:
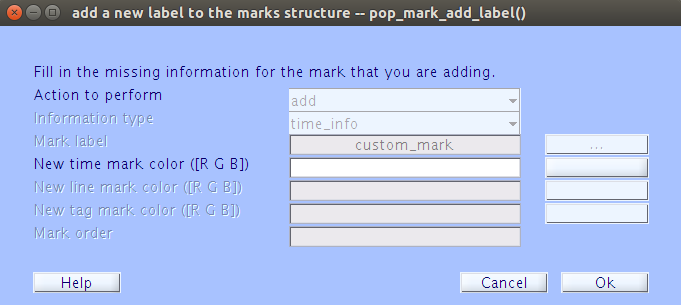
m,ve_edit('awm','custom_mark')Using an addition mark for the first time will cause the following popup to appear:
-
It should already be populated with most of the information you provided. Make sure you select a color for the mark by typing in the [R G B] or by clicking the
| |button and selecting from the color pallet. Once you have finished with this pop up, you should see the mark appear at the top of the data.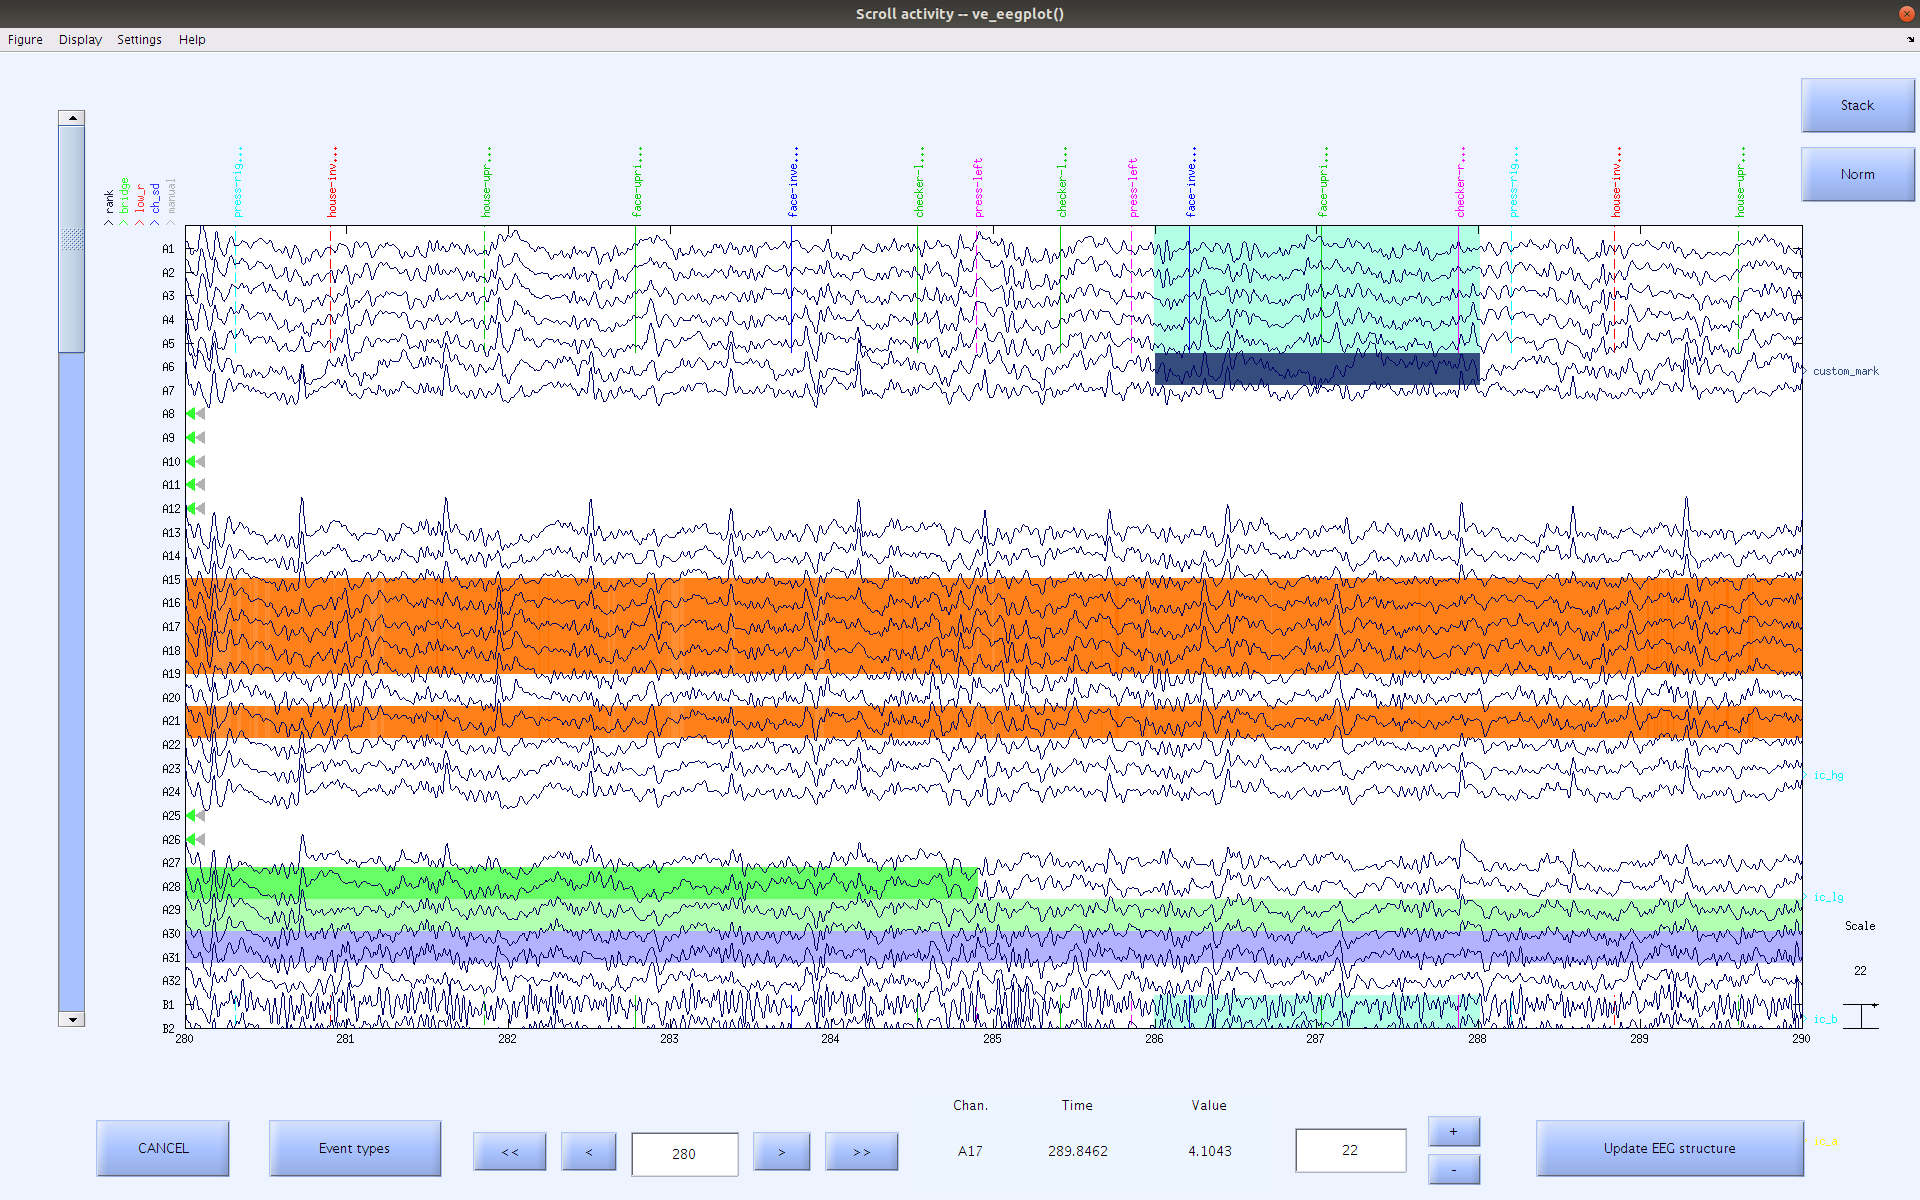
-
In this example, the navy blue ‘custom_mark’ (see the name on the right side of the window) that we created above, was added to the area where the winrej had highlighted from approximately 286 to 288 seconds.
Removing a Mark
The process to remove a mark is very similar to adding. Start by using the winrej tool to select the area where you would like to remove a mark. Make sure to keep your mouse hovered over that selection when pressing your designated remove key. In the example below part of the navy blue mark called ‘custom_mark’ will be removed with the rwm command specified to remove ‘custom_mark’ by using the string:
M,ve_edit('rwm','custom_mark')
OR
M,ve_edit('rwm','pop_select')
No popups will appear in the first case because custom_mark was explicitly specified to be removed. In the second case, a popup menu will appear, and you will be able to select any of the existing marks, making it a more versatile but less efficient hotkey command.

Completing the Session
Once you have marked the data as you would like, you will need to click the | Update EEG Structure | button at the bottom right of the window. This will take the marks that you have added/removed/modified and update them in the EEG.marks structure. This will NOT save a new file or overwrite the old one. It will only modify the marks structure within EEGLAB. To save the changes to a file, navigate to File->Save current dataset(s) to overwrite the old file with the new marks, or navigate to File->Save current dataset as to save a new file.
Key Points
Assign key bindings in the vised config file to enable different actions in the scroll plot.
This plugin allows for quick and versatile flagging of the data in an intuitive visual environment.