Options
Overview
Teaching: 20 min
Exercises: 0 minQuestions
What are all the options available within the Vised Marks plugin?
Objectives
Explore an exhaustive list of all the options available in the Vised Marks plugin.
Getting Started
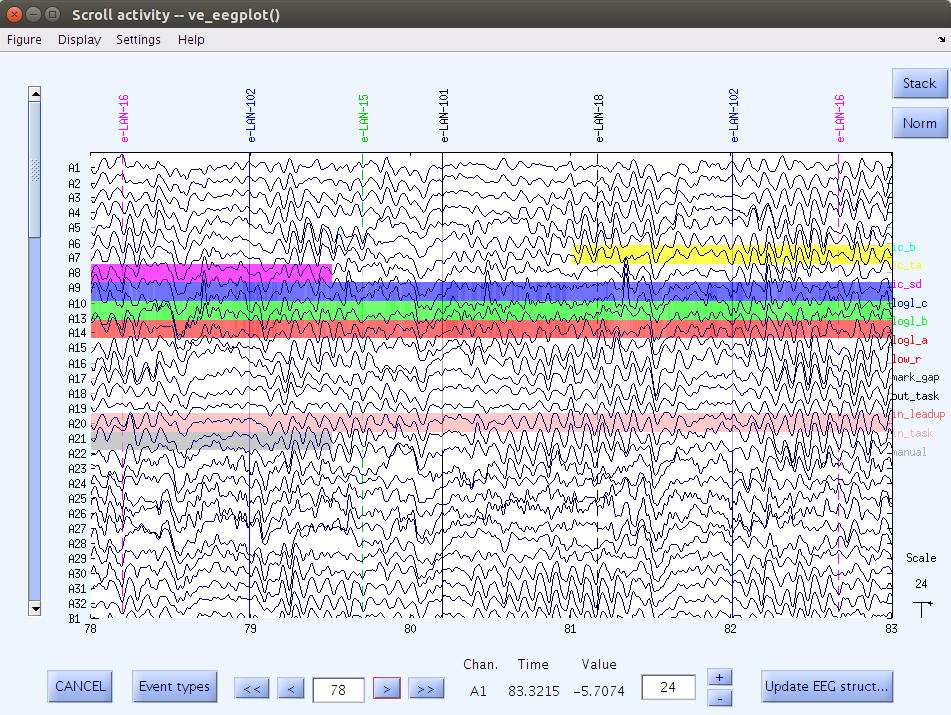
Editing data using this method is a manual way for you to inspect the scroll data and at the same time mark it up into different components. This method can be used before and after editing the data using scripts, depending on what aspects of the data you are looking at. Marks can help you visually interpret the data and will also save the marks selections on the data that you have made. This information can be used later to isolate or chop up the data into the different selections.
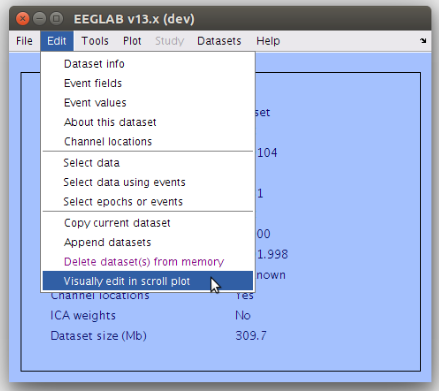
In order to start directly editing and placing marks, load the scroll data by navigating to Edit->Visually Edit in Scroll Plot.
The first pop up that shows up should look similar to the figure below.
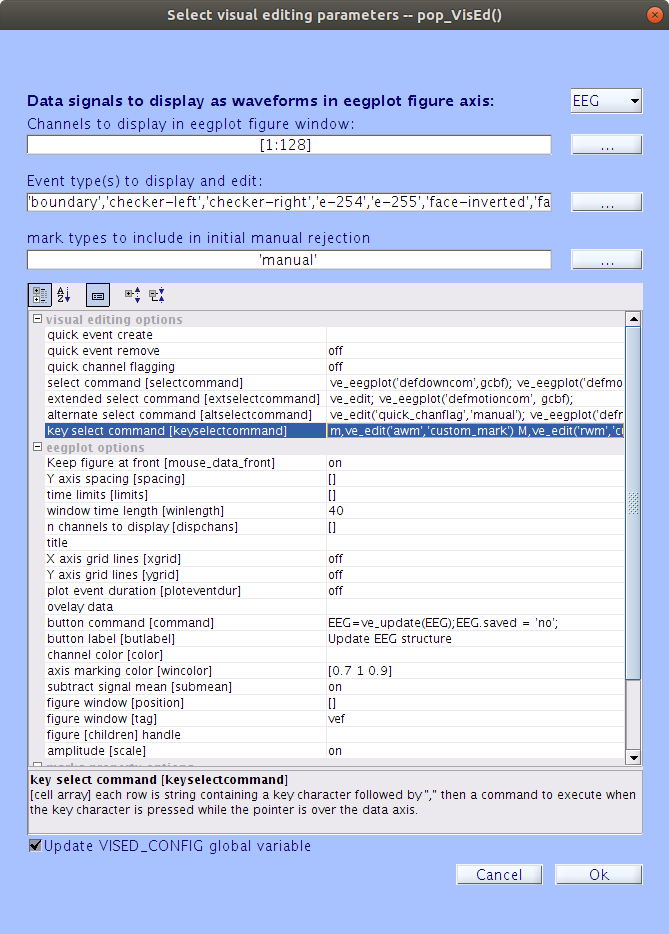
If you haven’t already, go check out the using vised episode to find out what each of these interface fields are. If you have already created or loaded a configuration file then most of these fields will already be complete.
The most important field for this manual editing method is the key select command [keyselectcommand] as it is where you can define each of your editing key strokes. You will be creating a cell array of strings that should follow the following pattern, with one [key press/function] on each line:
key_press,function_called('key_action1','key_value1'...'key_action2','key_value2'...)
First is the keyboard key that you going to assign a certain action to, followed by a comma and the function that you be calling with this key press. Typically, this is ve_eegplot() or ve_edit(). These functions are explained on the Functions Wiki Page on Github, as well as in the built in Matlab help command.
The ve_eegplot() and ve_edit() functions both contain different common actions you may want as hotkeys in them, some of which are outlined below. You can call as many key_actions as you would like in the same function. You can also assign a key to call two different functions by simply creating a new line and reusing the same designated key stroke.
ve_eegplot
| key_action | key_value | Description |
|---|---|---|
| ‘topoplot’ | [figure handle] | Draws a topographic plot of the time selected |
| ‘drawp’ | [movement direction] | Refreshes and redraws the figure |
Where movement direction is:
0 - to redraw
1 - to move left by one window
2 - to move left by one second
3 - to move right by one second
4 - to move right by one window
ve_edit
| key_action | key_value | Description |
|---|---|---|
| ‘quick_event_make’ or ‘qem’ | [‘name_of_event’] | Insert event at latency of mouse pointer |
| ‘quick_channel_flag’ or ‘qcf’ | [‘name_of_chan_info_mark_label’] | Flag the channel at mouse pointer with the named mark. |
| ‘select_mark’ or ‘sm’ | [‘on’ or ‘off’] | Select (winrej highlight) the period of time flagged by time_info mark under the mouse pointer. |
| ‘add_winrej_marks’ or ‘awm’ | [‘name_of_time_info_mark’] | Insert a mark on the data selected by the winrej highlight under the mouse pointer. |
| ‘remove_winrej_mark’ or ‘rwm’ | [‘name_of_time_info_mark’] | Remove the named time_info mark on for the period of winrej highlight under the mouse pointer. If the ‘name_of_time_info_mark’ is set as ‘pop_select’ a pop up selection appears on each use. |
| ‘add_page_mark’ or ‘apm’ | [‘name_of_time_info_mark’] | Applies a mark to the whole page window. |
| ‘remove_page_mark’ or ‘rpm’ | [‘name_of_time_info_mark’] | Removes a mark from the whole page window. |
| ‘page_forward’ or ‘pf’ | [‘on’ or ‘off’] | Moves 1 page forward, based on the time displayed. |
| ‘data_move’ or ‘dm’ | [‘on’ or ‘off’] | Data move from data2 to data array for selected period. |
Once you have input all of the keystrokes that you want to be editing with, you should make sure that the other configuration settings are also set as desired. Across the top of the pop up page there are four additional selections that were not in the configuration interface:

You can change these fields by typing or by clicking the | ... | button and using the selection tool.
- Channels to display in the window: In this field, you can select what channels/components you would like to display in the pop up scroll data window. Alternatively you can also use the number of channels to display option in the main config fields and use the side scroll bar to navigate the window.
- Events to display: This will filter which events will be displayed on the scroll data.
- Mark types to include in rejection: This section contains the types of marks that you will be rejecting when you click the Update EEG Structure button. By default this field contains manual marks.
- At the top right there is a drop down selection between EEG and ICA data types. The marking system works the same way in ICA components mode, except instead of displaying the channel data it will display the component data.
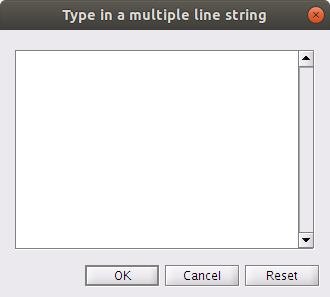
If you leave the function ve_edit() blank, then your keystroke will give you the following popup menu to create an action:
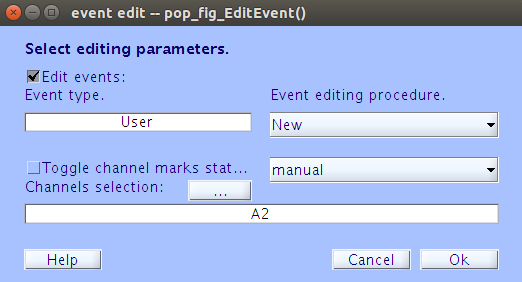
From this interface you can either create an event or toggle a channel command.
- Event
- Make sure the Edit events button is selected.
- Under Event type, type the event name.
- Click
| Ok |. - You should see a new event line created where your mouse was positioned.
- Channel
- Make sure the Toggle channel marks status button is selected.
- Select the mark designation (manual type is the default, but you can also make this the same as other channel/component marks).
- Select the channel/component you wish to apply this to.
- Click
| Ok |. - You should see that the channel/component you selected is now highlighted with the designated mark color.
Visual Editing Options
The first group of configuration options deal with assigning hotkeys to different plotting functions. These will allow you to quickly add visual marks to the the data scroll plot when using the Editing Marks Visually method.
Quick Event Create
String event type to immediately add (without a pop up window) when the alternate press ([Ctrl + left-click] or [right-click]) is executed on the eegplot data axis. This option overwrites any other specification for altselectcommand at run time (Default = ‘’ = no quick event).
Quick Event Remove
- Enable single click event removal (no pop up GUI).
- “ext_press” = remove event when [Shift + left-click] is executed on events in the eegplot figure axis.
- “alt_press” = remove event when [Ctrl + left-click] or [right-click] is executed on events in the eegplot figure axis.
- When set to “alt_press” this option will overwrite any other specification for altselectcommand at run time.
- When set to “ext_select” this option will overwrite any other specification for extselectcommand (including quick_evtmk) at run time.
Quick Channel Flagging
- Enable single click channel flag toggle (no pop up GUI).
- “ext_press” = toggle channel flag when [Shift + left-click] is executed on event in eegplot figure axis.
- “alt_press” = toggle channel flag when [Ctrl + left-click] or [right-click] is executed on event in eegplot figure axis
- Select Command [selectcommand]
- [cell array] list of 3 commands (strings) to run when [left-click] is pressed, when it is moving, and when it is up.
- Extended Select Command [extselectcommand]
- [cell array] list of 3 commands (strings) to run when [Ctrl + Shift] is pressed, when it is moving, and when it is up.
- Alternate Select Command [altselectcommand]
- [cell array] list of 3 commands (strings) to run when [Ctrl + left-click] or [right-click] is pressed, when it is moving, and when it is up.
All of the select commands above use cell arrays to capture the field data. Make sure you use the following structure, with each function ending with a semicolon and a new line at the end:
function_called('key_action1','key_value1'...'key_action2','key_value2'...);
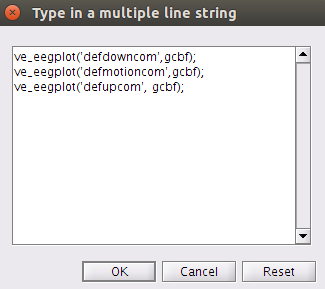
- Key Select Command [keyselectcommand]
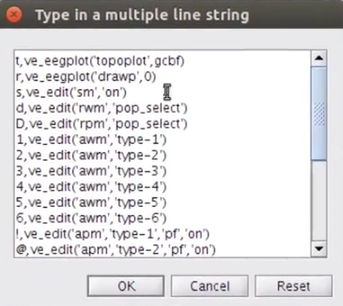
- [cell array] each row is string containing a key character followed by “,” then a command to execute when the key character is pressed while the pointer is over the data axis.
- This select command uses a cell array to capture the field data. Make sure you use the following structure, with each [key press,function] combination on a separate line:
key_press,function_called('key_action1','key_value1'...'key_action2','key_value2'...)
First is the keyboard key that you are going to assign a certain action to, followed by a comma and the function that will be called with this key press. Typically this will be ve_eegplot() or ve_edit(). The inputs to these functions are explained in more detail in the Edit Data Visually episode.
EEG Plot Options
The second group of configuration options deal with creating a default setting for the scroll data pop up. This allows you to control how large the plot is, the window time length, the number of channels to display, and more.
- Keep figure at front [mouse_data_front]
- [‘on’ ‘off’] When mouse moves over the data axis bring/keep the eegplot figure window at the front (default = ‘on’)
- Sampling Rate [srate]
- Sampling rate in Hz (default = 256Hz). Use this in the calculation of times labels on the x axis of the eegplot scroll window.
- Y-axis spacing [spacing]
- Display range per channel (default = 0:max(whole_data)-min(whole_data)). this is the y-axis distance in uV between the zero value of each waveform in the eegplot scroll window.
- Time Limits [limits]
- [start end] Time limits for data epochs in ms (for labelling purposes only).
- Window Time Length [winlength]
- [value] Seconds (or epochs) of data to display in window (default = 5).
- n Channels to Display [dispchans]
- [integer] Number of channels to display in the activity window (default: from data). If less than total number of channels, a vertical slider on the left side of the figure allows vertical data scrolling.
- Title
- Figure title (default = none).
- X-Axis Grid Lines [xgrid]
- [‘on’ ‘off’] Toggle display of the x-axis grid (default = ‘off’)
- Y-Axis Grid Lines [ygrid]
- [‘on’ ‘off’] Toggle display of the y-axis grid (default = ‘off’)
- Plot Event Duration [ploteventdur]
- [‘on’ ‘off’] Toggle display of event duration (default = ‘off’)
- Overlay Data [data2]
- [float array] identical size to the original data and plotted on top of it.
- This is particularly useful when comparing an artefact corrected dataset with its predecessor. You can see both side by side and determine what parts you should keep from each.
- Button Command [command]
- [‘string’] Matlab command to evaluate when the ‘REJECT’ button is clicked. The ‘REJECT’ button is visible only if this parameter is not empty. As explained in the “Output” section below, the variable TMPREJ’ contains the rejected windows (see the functions
eegplot2event()andeegplot2trial()).
- [‘string’] Matlab command to evaluate when the ‘REJECT’ button is clicked. The ‘REJECT’ button is visible only if this parameter is not empty. As explained in the “Output” section below, the variable TMPREJ’ contains the rejected windows (see the functions
- Button Label [butlabel]
- Reject button label. (default = ‘REJECT’)
- Channel Color [color]
- [‘on’ ‘off’ {cell array}] Plot channels with different colors. If an RGB cell array {‘r’ ‘g’ ‘b’}, channels will be plotted using the cell-array color elements in cyclic order (default = ‘off’).
- Axis Marking Color [wincolor]
- [color] Color to use to mark data stretches or epochs (default = [0.7 1 0.9] is the default marking color).
- Subtract Signal Mean [submean]
- [‘on’ ‘off’] Remove channel means in each window (default = ‘on’).
- Figure Window [position]
- [lowleft_x lowleft_y width height] Position of the figure in pixels.
- Figure Window [tag]
- [string] Matlab object tag to identify this
eegplot()window (allows keeping track of several simultaneouseegplot()windows).
- [string] Matlab object tag to identify this
- Figure [children] Handle
- [integer] Figure handle of a dependent
eegplot()window. Scrolling horizontally in the master window will produce the same scroll in the dependent window. Allows comparison of two concurrent datasets, or of channel and component data from the same dataset.
- [integer] Figure handle of a dependent
- Amplitude [scale]
- [‘on’ ‘off’] Display the amplitude scale (default = ‘on’).
Marks Property Options
This last section of the configuration deals with adjusting how your marks will appear visually on the scroll data. This includes transparency and spacing.
- Marks Y-axis Location [marks_y_loc]
- Location along the y axis (percent from bottom to top) to display the marks structure flags (default = .8). May also be an array of values to plot.
- Inter-Mark Interval [inter_mark_int]
- Distance along the y axis (percent from bottom to top) to separate each marks type (default = .04).
- Inter_tag Interval [inter_tag_int]
- Distance along the x-axis (percent from left to right) to separate each channel tag pointing at flagged channel labels (default = .002).
- Color Interval [marks_col_int]
- Marks surface plots depict values between 0 to 1. The [marks_col_int] sets the interval of color change in the plot (default = .1).
- Marks Surface Plot Transparency [marks_col_alpha]
- Alpha is a value between 0 and 1 where 0 = transparent and 1 = opaque (default = .7).
Key Points
FIXME