Running the Quality Control Script
Overview
Teaching: 5 min
Exercises: 10 minQuestions
How do I run the quality control procedure?
What does the quality control procedure look like?
Objectives
Understand how to start the quality control procedure.
Become familiar with the figures displayed during quality control.
-
Open MATLAB (pre-2014b works fastest) and change your Current Folder by navigating to the Lossless pipeline root directory (in this case,
Face13). -
Open EEGLAB by typing the following into the command window:
>> addpath derivatives/EEG-IP-L/code/install >> lossless_path >> eeglab -
If you are using an older version of MATLAB (pre-2014b), you will need to set the default figure renderer to OpenGL by typing the following into the command window:
>> set(0,'DefaultFigureRenderer','OpenGL'); -
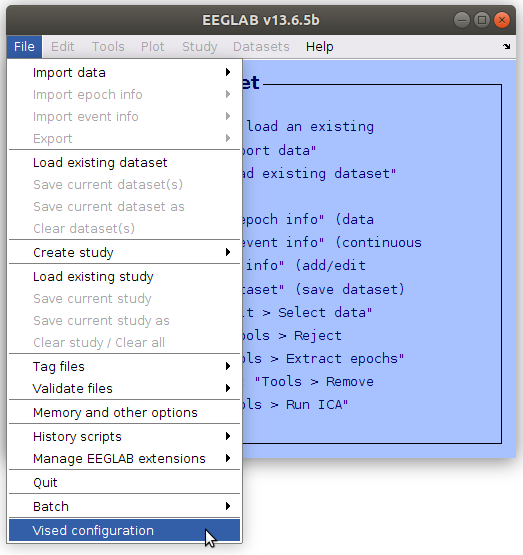
In the main EEGLAB window, navigate to File->Vised Configuration.
-
Add the vised configuration file by clicking
| Load vised config |and then navigate to the config folder (derivatives/EEG-IP-L/code/config/). Select the file namedvised_config_qc.cfg, and click| OK |. The vised configuration file will load certain settings that are preferable for the quality control (QC) procedure.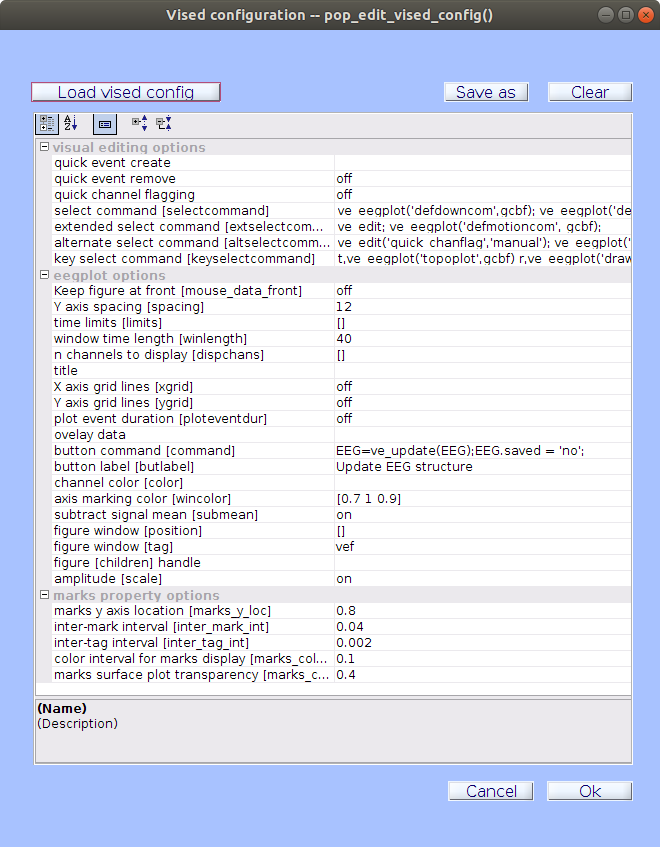
-
In the main EEGLAB window, navigate to File->Batch->Run History Template Batch.
-
In the Run History Template Batch window, add a Context configuration file by clicking
| Load context config |. The default file will be sufficient for this task:derivatives/EEG-IP-L/code/config/contextconfig.cfg. -
Click
| History File |and add theqc.htbscript located inderivatives/EEG-IP-L/code/scripts/.
Note
The
qc.htbscript is optimized to be run with a three monitor setup. If you do not have access to three monitors you should load theqc_lite.htbscript located inderivatives/EEG-IP-L/code/scripts/.
-
Open up a terminal window, and navigate to your project root directory:
>> cd path/to/project/directory/Face13 -
In the terminal, list all the data files you would like to run through the QC procedure. This can be done using the find command. If using the BIDS directory structure, simply type:
>> find derivatives/EEG-IP-L -name "*_ll.set" -
This will print a list of all the files that have run through the pipeline, which you can then copy straight from the terminal into the file field in the Run History Template Batch window, with one path/filename per line. The history template batch window should look like this:
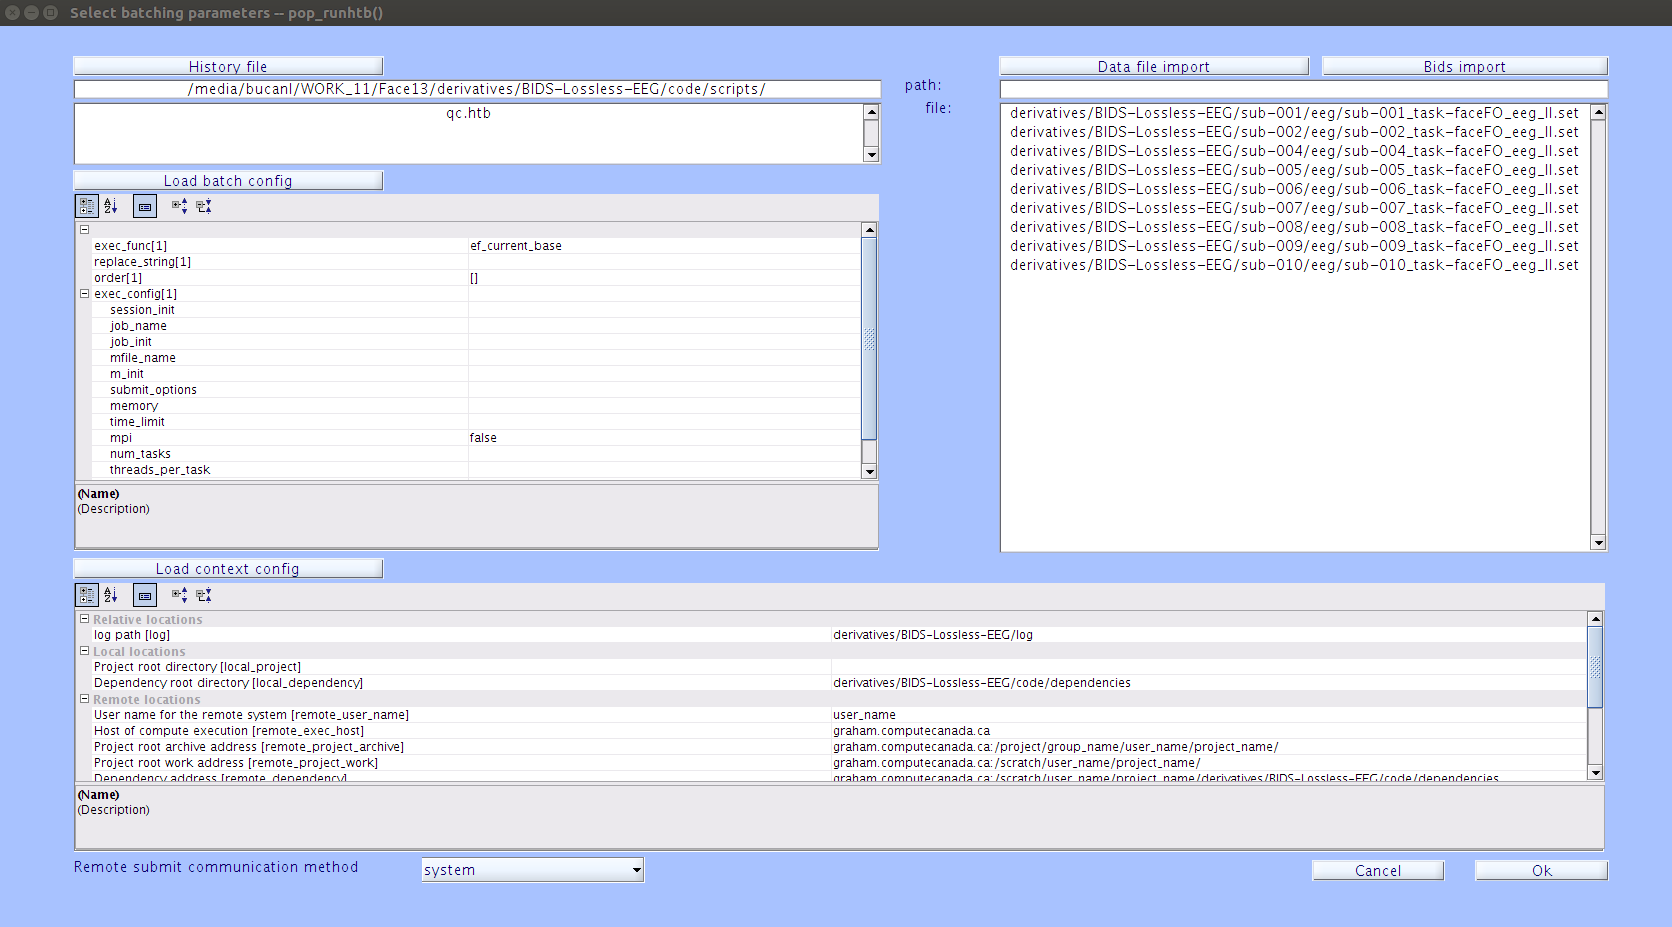
-
Click
| Ok |to start the QC batch process. -
Once you click
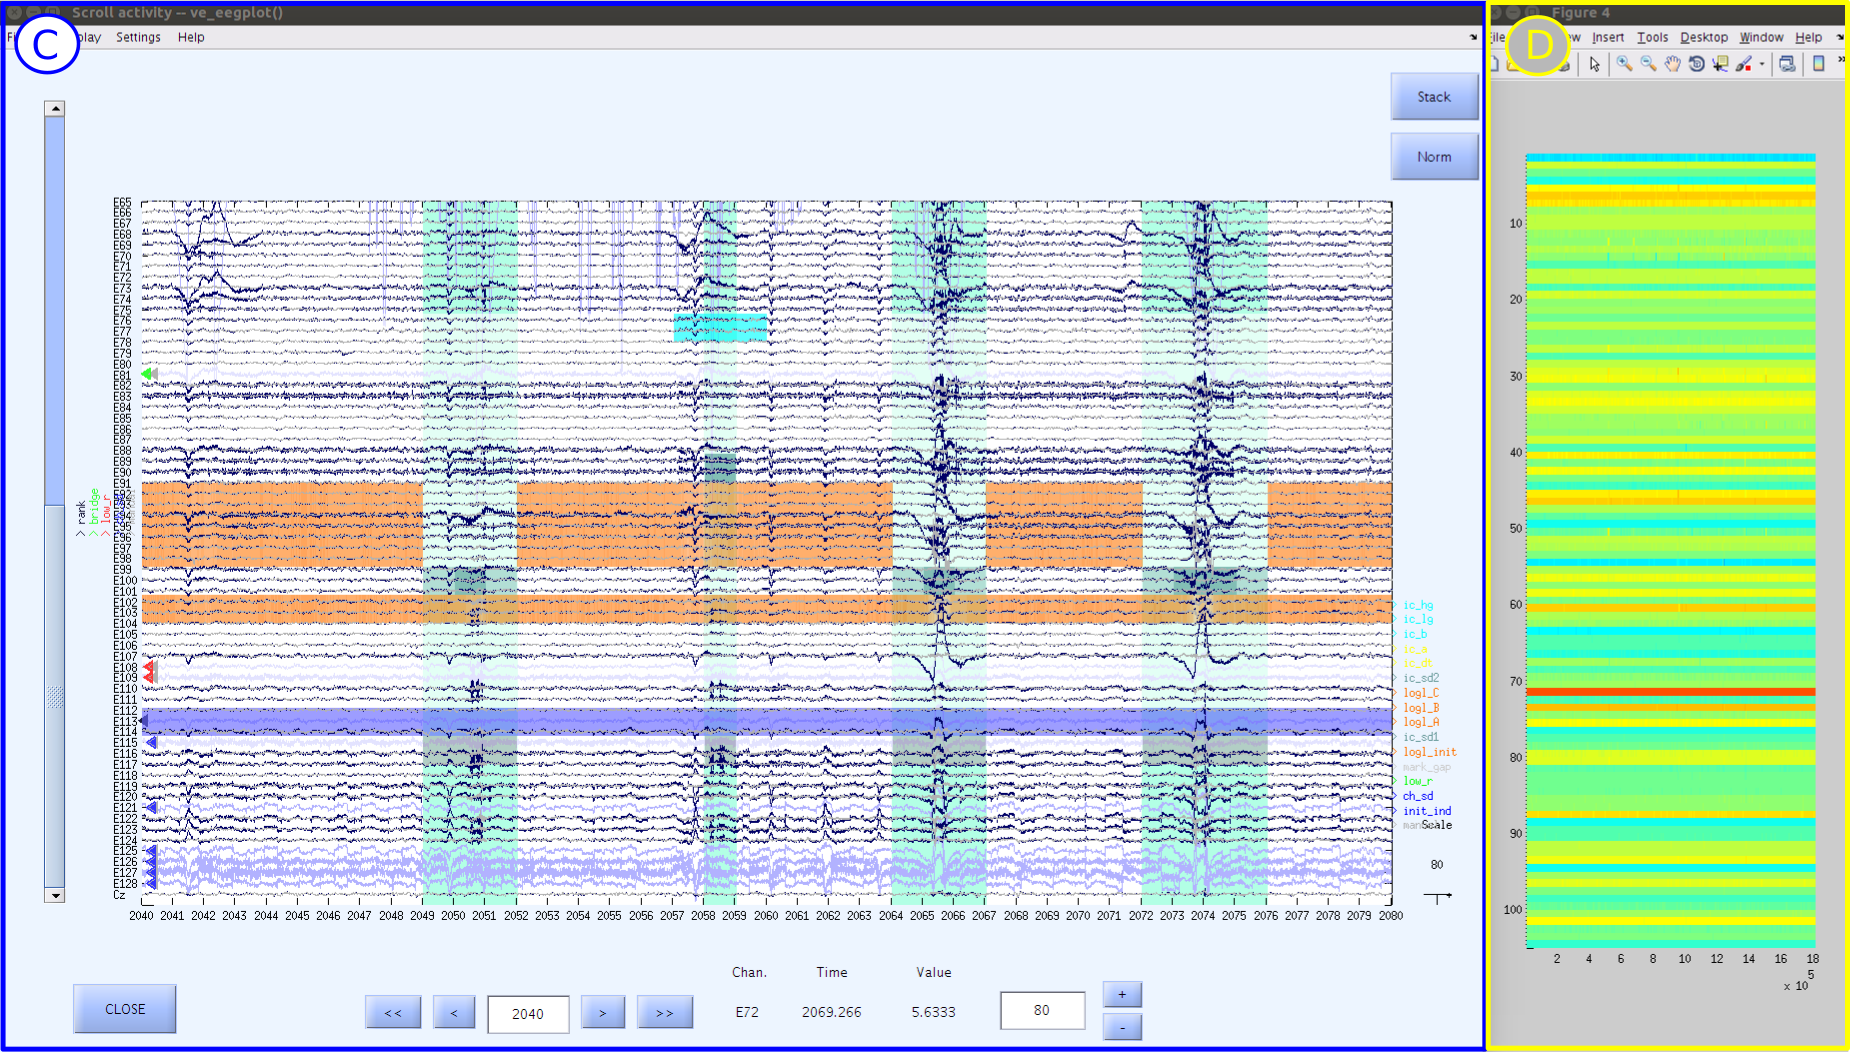
| Ok |, the QC windows will open for your first file. The files will open in alphabetical order. Several windows will open for each file you QC, including:A. A window that displays the component EEG data. This is the window that you will be interacting with as you QC. You will be making your decisions in this window by adding or removing a manual mark for components or time points. Components are sorted by the percent data variance accounted for, with the top components accounting for a greater percentage of the channel data. To scroll through the data, use the
<<and>>buttons in this window. These buttons will scroll both the component EEG data and the channel EEG data windows (Figure C). Your decisions can be saved by clicking the| Update EEG Structure |button in the component EEG data window.B. A figure that displays the ICLabel classification breakdown for each component. This figure will not be loaded when running the
qc_lite.htbscript.C. A window that shows the channel EEG data. It also contains an overlay feature that can be toggled on/off or updated while quality controlling. Use of this feature will be explained in subsequent lessons.
D. A figure that displays an array of squares corresponding to each 1-second epoch for each component. Each square is colored based on its activation difference from the mean. This figure will not be loaded when running the
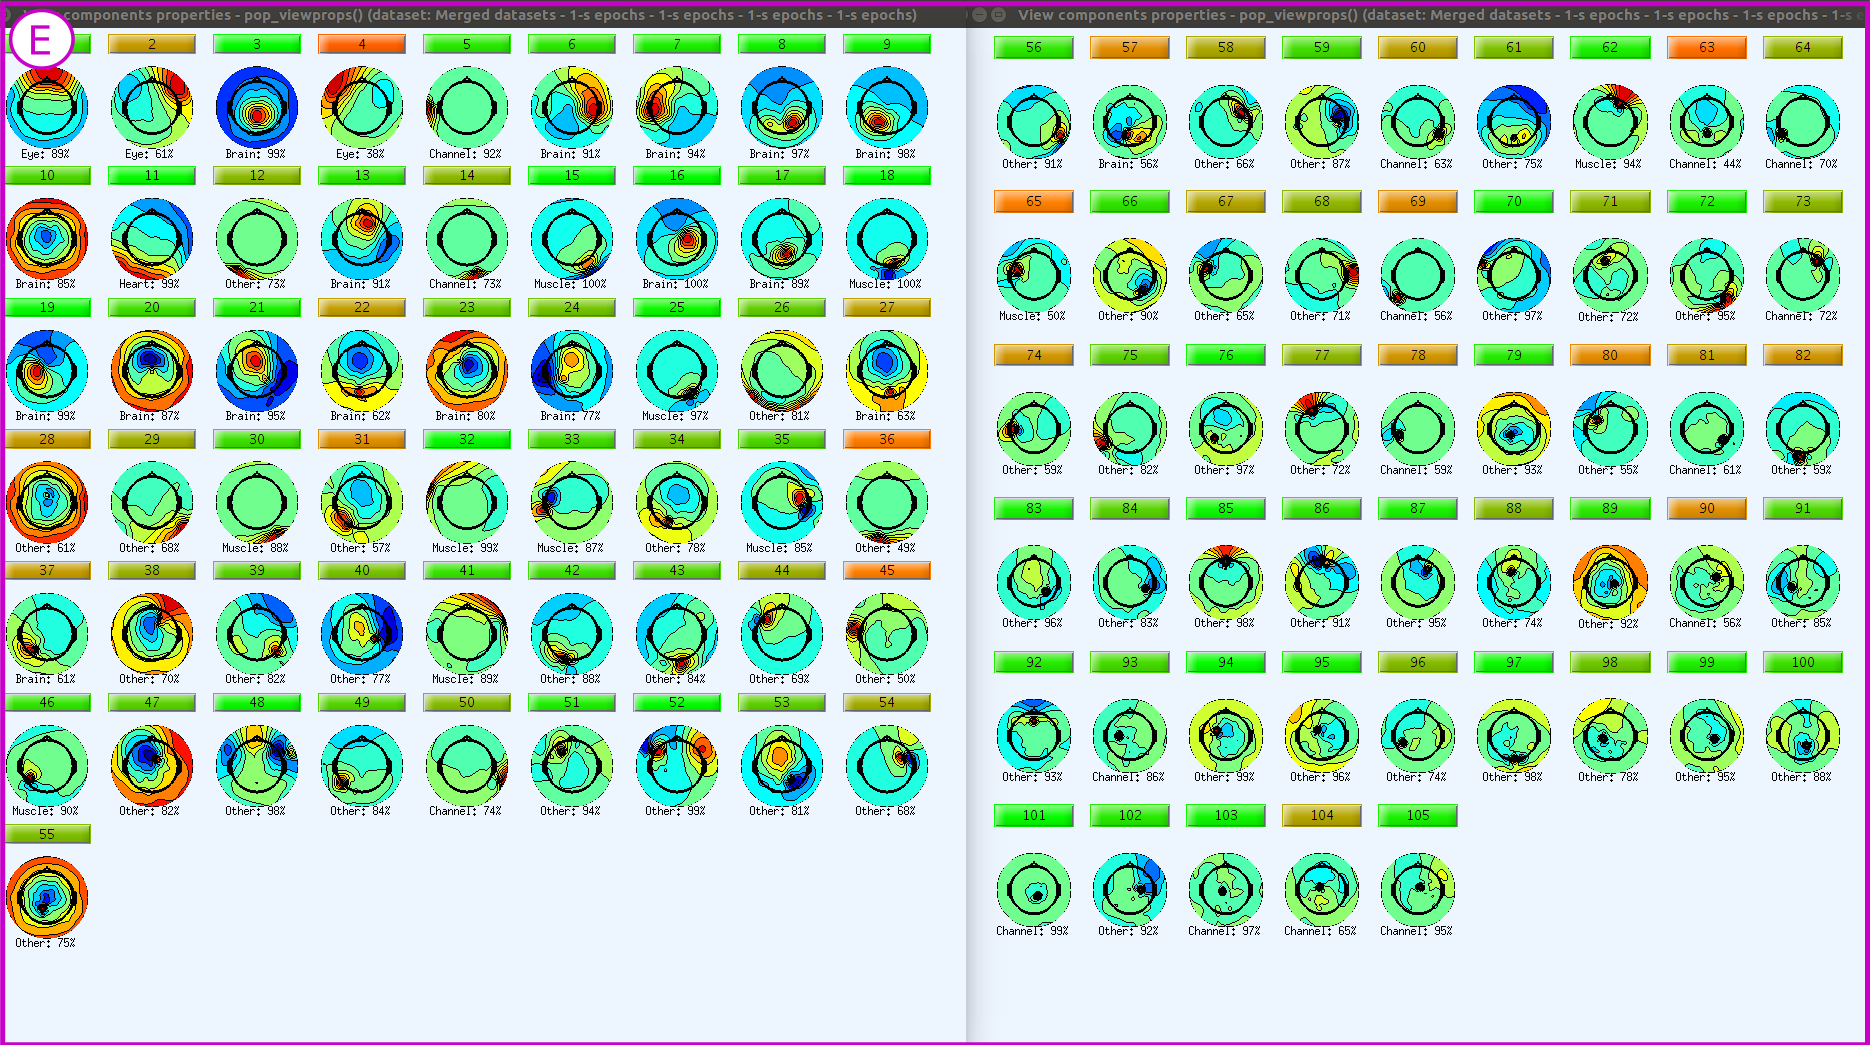
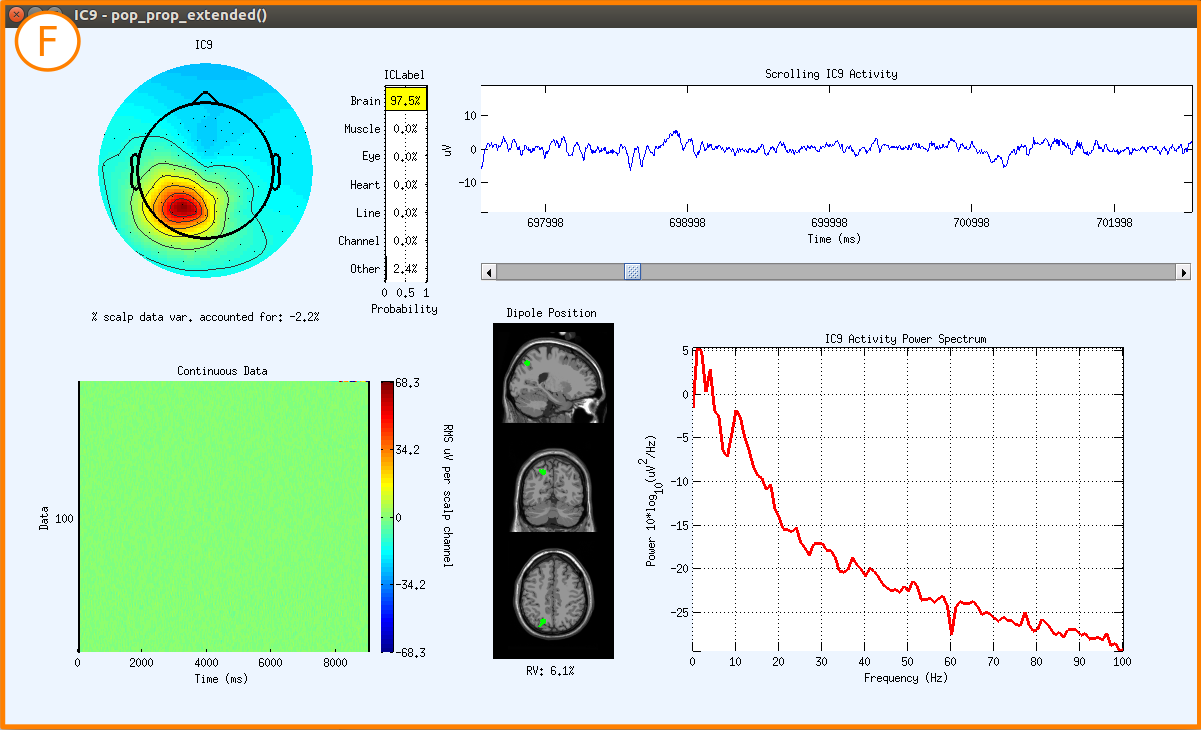
qc_lite.htbscript.E. Window(s) with a topography for each component. The number label for each topography can be clicked to gain more information.
F. Upon clicking a number label for a component a figure appears which displays the component’s spectrum, dipole location, and a mini scroll plot of the full waveform of the selected component. More information on how to interpret this figure can be found in the ICLabel Tutorial.
Note
Feel free to move figures around to suit your needs. For the
qc_lite.htbscript this is strongly recommended.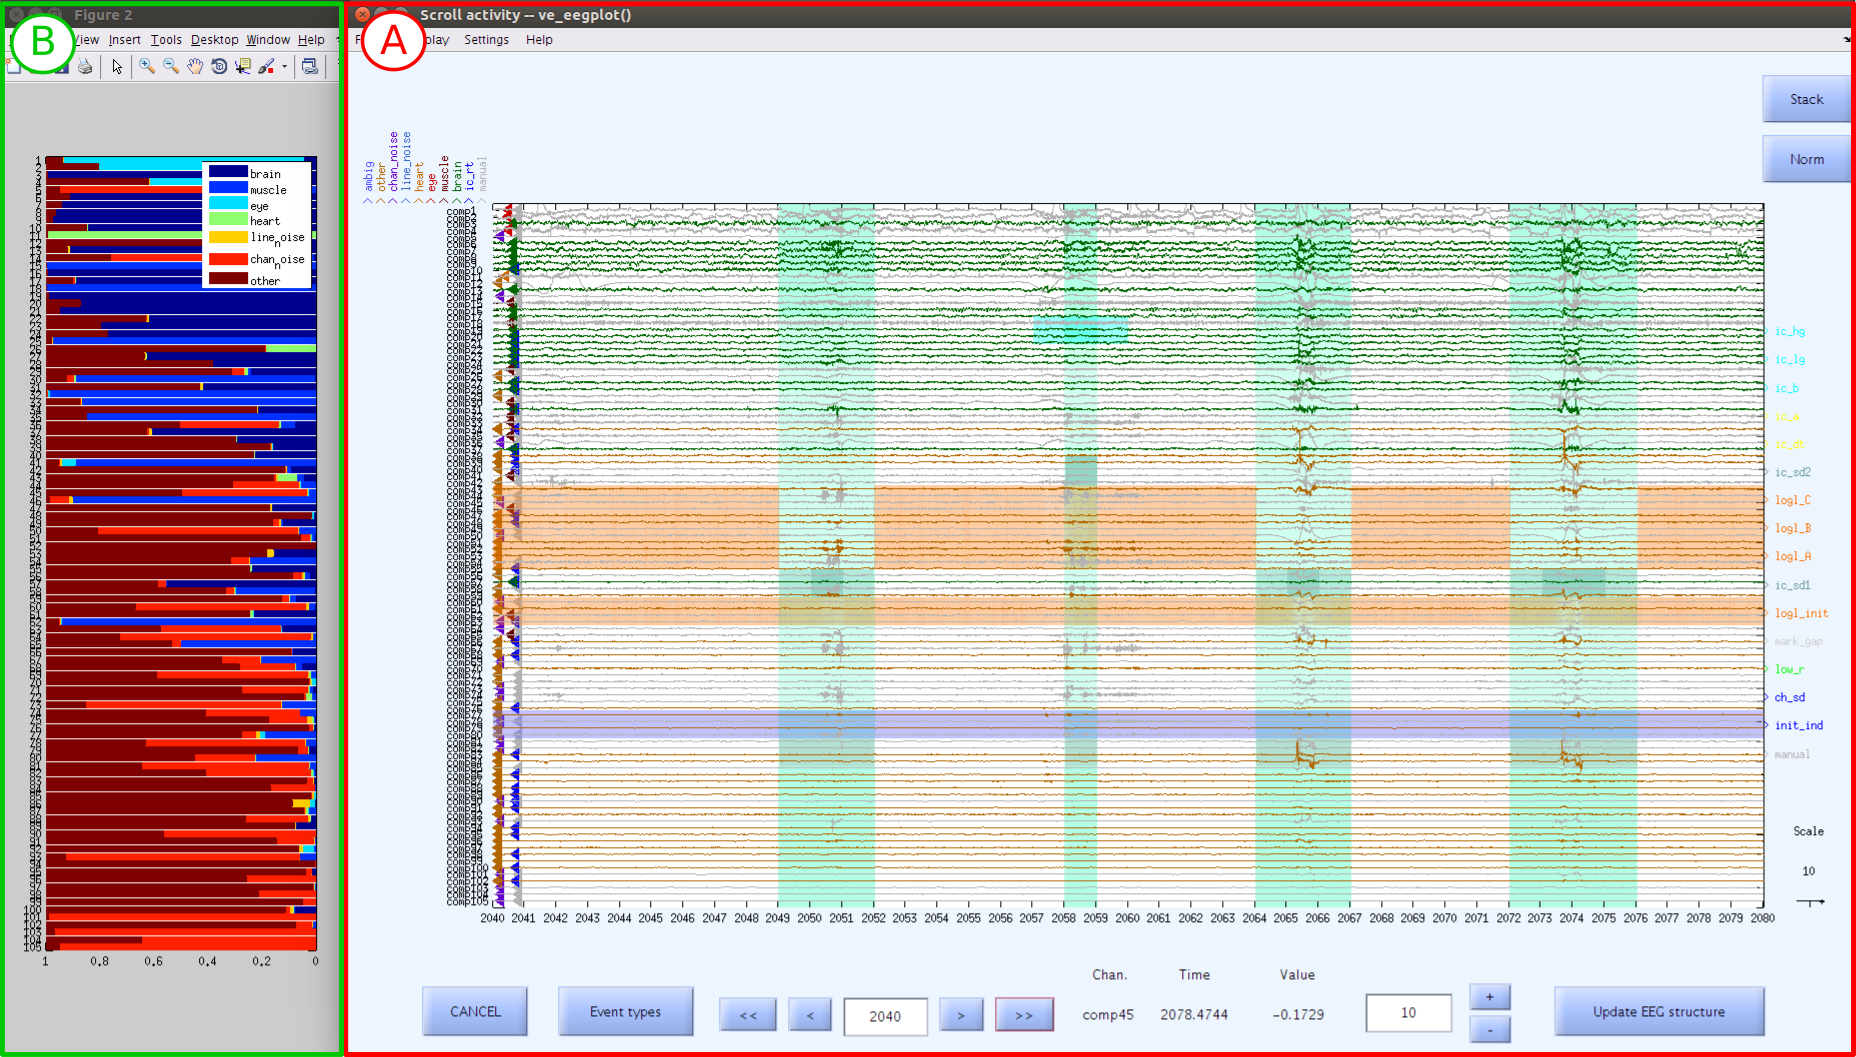
Exiting the QC Procedure
If you would like to cancel the QC procedure at anytime without saving the progress, you will need to force quit the QC script by typing [Ctrl + C] in the MATLAB command window.
Key Points
The input for running the QC script is
*_ll.setfiles.The QC procedure is a manual review of the decsions the pipeline made. The annontations in the component EEG data scroll can be edited to update decisions about the data.
The output is
*_qcr.set*files which contain the updated annotation information.